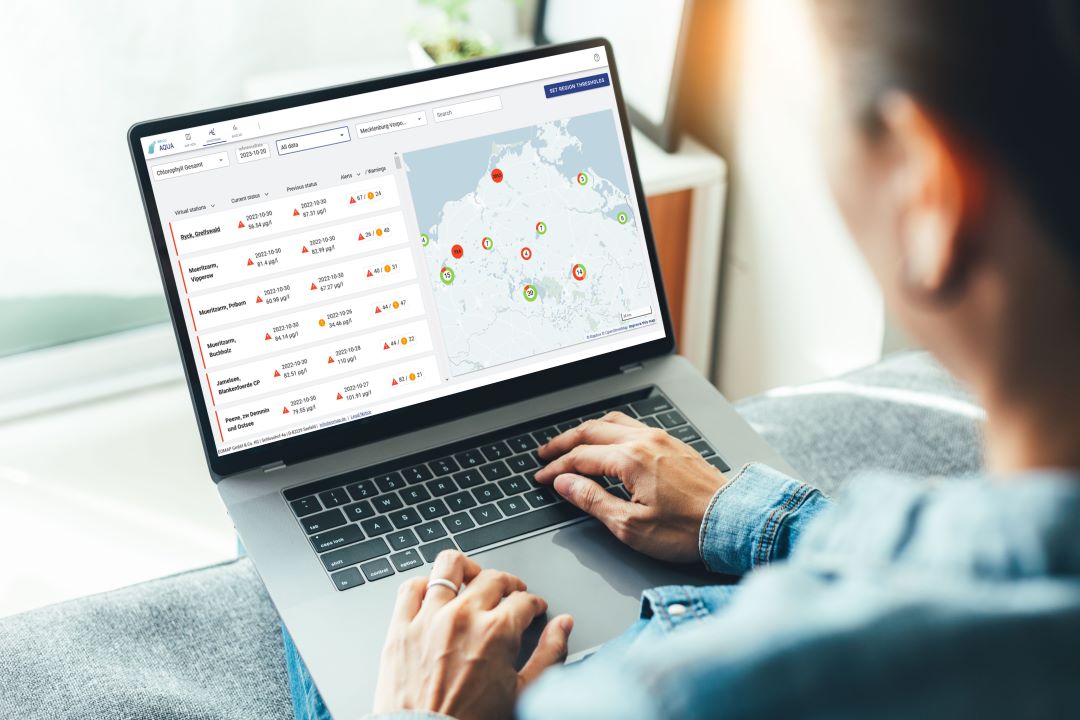
As of 20th January, 2025, the revamped web app enables you to analyse water quality even more quickly and easily. – Below the image, you will find details on the new tools as well as on the improved visualisation and workflows. Access the new eoapp AQUA here.
In “Map View”, you can now
- Directly switch from any virtual station to Monitoring or Baseline View
- Display multiple in-situ layers with remote sensing data in time series graphs
- Show various time series aggregates (daily, monthly, custom) in a graph
- Select sensors specific virtual stations to display different sensor data products within each time series

“Map View” has been further enhanced for you to
- Choose options for displaying and toggling true-colour images and data products
- Modify colour maps for data products with customizable colour display and scaling options to enhance visualization, particularly for low-concentration water substances
- Filter out data points within time series that represent small areas relative to the size of the virtual station of interest
 In “Monitoring”, eoapp AQUA now offers
- A new user interface allowing direct access to virtual station time series without setting regional limits
- The ability to rearrange time series plots for better simultaneous data product evaluation and situation analysis
- Visualisation of station statistics within time series, including medians, means, and station statistics per data point.
We will switch to the upgraded version of eoapp AQUA on 20 January 2025. All your data and virtual stations remain unaffected and accessible as per your agreement with us.
Please contact us in case of any uncertainties. We’ll be glad to help.
Latest EOMAP News


Related Posts

03 / 2026
Quick Facts: Lake Eyre

02 / 2026
WATCOR‑X Bathymetry Software for Navies and Hydrographic Offices

02 / 2026
Quick Facts: Ancient Lakes

01 / 2026
Space-based Intelligence for Clean Energy

01 / 2026
Pro-active hydropower management in winter

12 / 2025
From Climate to Nature and Biodiversity: Insights on COP30

12 / 2025
Water Crisis in Iran – Lessons to be learned

11 / 2025
Italian Webinar: Water Quality Monitoring from Space

10 / 2025
New Storymap: Bathing Water Monitoring from Space

09 / 2025
