Land Use, Habitats and Infrastructure Mapping

EO Mapping Services

Introduction

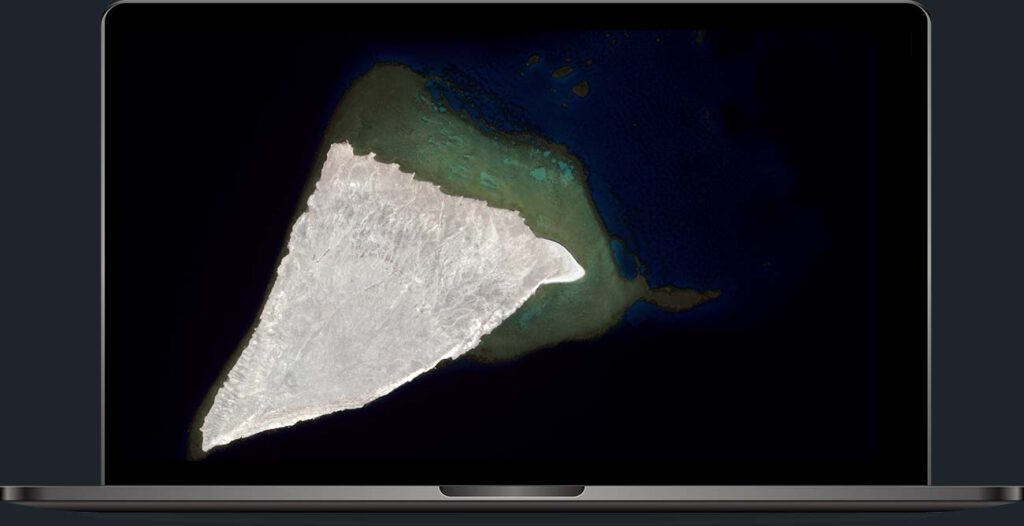
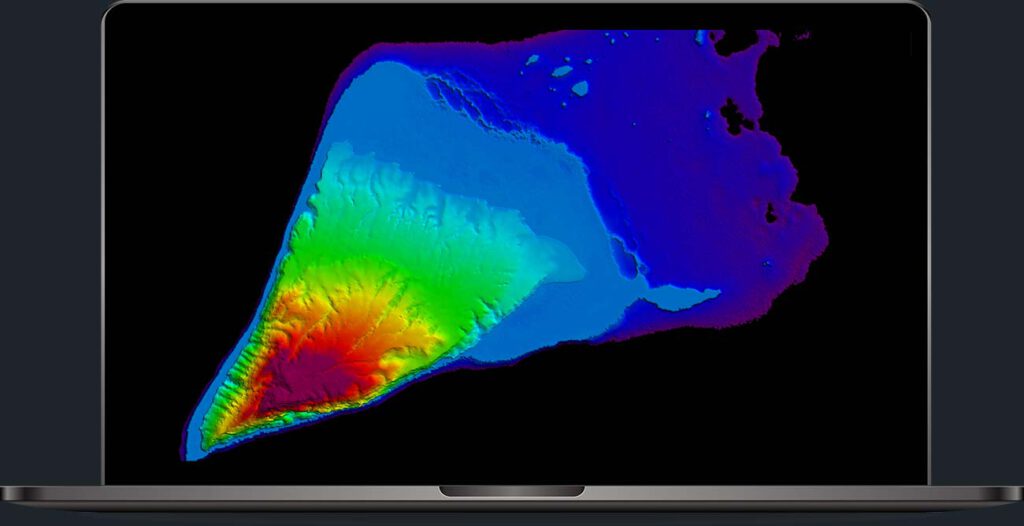
Mapping and observing the Earth’s surface cover is the oldest of all satellite imaging applications. Today we can make detailed pictures of the Earth using multispectral, very high-resolution data with a spatial resolution (pixel size) of 30 cm, and high-resolution radar data.

EOMAP follows a multiple step approach for the mapping of land use and land cover. We first take time to understand what you’re looking for, define a classification schema and the desired quality. We then access all relevant satellite imagery and perform pre-processing steps such as atmospheric correction and spectral filtering. This helps to improve the quality of the thematic classification, which is finally performed by object-based classification procedures. We use four main characteristics to classify surface objects – their spectra (colour), shape, texture and temporal change. Following this we run calibration and validation procedures quality assurance and control processes to provide you with a validated and robust mapping solution.

The chosen classification schema depends on your needs. It can range from the identification of a few, relatively simple classes, such as mangrove areas versus non-mangrove areas, to highly complex mapping at the level of species if on-site validation data is available.

Advantages at a glance

  • Make use of a physics-based, validated and stable solution rather than unwieldy alternatives.
  • Base your research on state-of the art image correction procedures.
  • With no need for satellite data access and pre-processing you have more time for your analytics and research.

Related Projects

FAQ

How can I request information for a specific site?
Simply send your area of interest in digital format to our team or use our contact form. You’ll receive appropriate feedback within 24 hours.

What makes EOMAP’s service unique? Why does your data service stand out?
We respect your specific requirements and adopt them in the classification processes. Based on these, we select the most relevant satellite data sources and offer the most appropriate approach.

What are the thematic mapping accuracies?
The mapping accuracies typically vary with the detail of the classification schema and classification complexity. Typically, our clients have validated our classification data to be in the range of 85-90% accuracy. This rate can be increased using on-site validation data.

What are the delivery formats?
The default file types of our seafloor classification data are vector shape files, which come with a PDF map and metadata. If you require grids or other formats, we can convert it on request.