Hydrology

Hydrology is the science of water movement, distribution, and quality in the Earth’s atmosphere and surface. It plays a crucial role in managing water resources, predicting floods, and understanding climate change impacts. Benefit from Earth Observation insights for hydrological modelling or analysis.

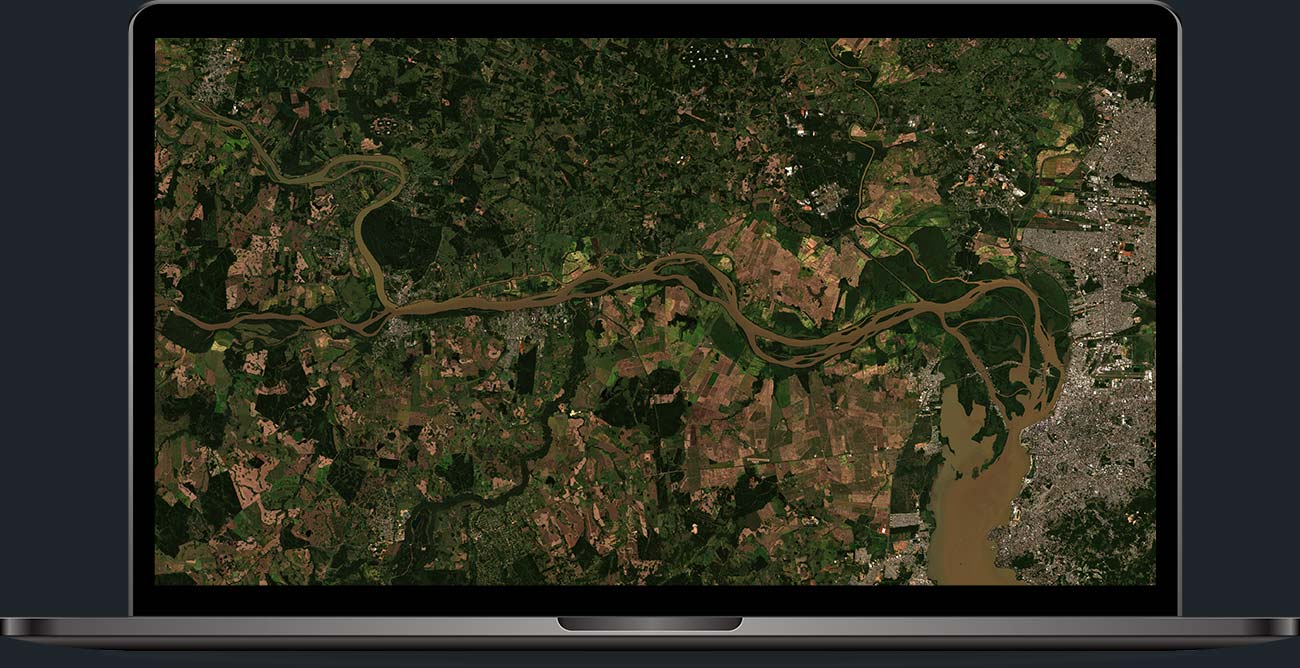
How your result could look

Satellite-based information on hydrology helps reveal flood risks, monitor snowpack evolution over large areas, or design hydropower installations.

Hydrology Before RgbHydrology After Rgb

What we measure

We provide a detailed suite of riverine data products designed to support hydrological studies and water resource management. Our offerings include:

Discharge measures the volume of water flowing through a river per second. The data is essential for understanding river dynamics and assessing flood risks.

Water level tracks the height of the water surface. These hydrological measurements are crucial for monitoring flood stages and managing water resources.

River Velocity indicates the speed of water flow. The data is particularly important for sediment transport and erosion studies.

River Width provides the measurement of the river’s width, aiding in hydrological modeling.

River Depth measures the depth of the river. This is vital for aquatic habitat studies, and flood modeling.

In addition to the measurements listed above, we can provide the following:

  • Filled Sink Digital Elevation Model (DEM)
  • Hydrologically Conditioned DEM
  • Flow Direction Raster: Represents the direction of water flow across the terrain.
  • Flow Accumulation Raster: Identifies areas of water accumulation, crucial for flood risk assessment.
  • Pour Point: Defines specific points where water flows out of a watershed.
  • Watershed Basins: Delineates drainage areas for effective watershed management.
  • Slope: Measures terrain steepness, essential for erosion and runoff modeling.
  • Aspect: Indicates slope direction, impacting solar radiation and microclimates.
  • Topographic Wetness Index (TWI): Assesses soil moisture potential based on terrain.
  • Strahler Order: Classifies stream hierarchy. These data products provide critical insights for hydrological projects.

Why choose EOMAP Hydrology services?

EOMAP’s expertise in data processing using DEMs enhances the accuracy of hydrological models. This ensures high-quality data analysis, supporting informed decision-making and sustainable water resource management.

Precision

EOMAP’s advanced data processing with DEMs improves the precision of hydrological models, aiding in accurate water flow and quality predictions.

Efficiency

High-quality data analysis by EOMAP supports effective water quality management, ensuring safe and clean water for communities.

Targeted

High-quality data analysis by EOMAP supports effective water quality management, ensuring safe and clean water for communities.

High Tech

Accurate data processing by EOMAP enhances the reliability of hydrological studies, supporting sustainable water resource management.

Learn more about Hydrology services

EOAPP HYPOS

Try the web app for hydropower management from space!

USE CASE

Learn about SnowPower, where snow water equivalent is derived from EO and meteorological data.

INFO CENTRE

Access product sheets, imagery and more

FAQs

Simply send your area of interest in digital format via our online webshop. You’ll receive our feedback within 24 hours on working days.

Records from Earth observation satellites go back up to 40 years. Using transferable processing technologies, we can generate water quality information from this historical data. The quality and resolution of the information might be lower for older satellite sensors compared with current systems.

A general rule of thumb is a minimum mapping unit of at least 5×5 water pixels, depending on the resolution of the satellites. For example, when using a 10m resolution.

During the contract period, clouds, cloud shadows, atmospheric aerosols and sunlight reflections on the water surface can reduce the number of available scenes and affect the number of pixels from the water surface. The satellite sources we obtain our data from have very frequent revisit times ranging from 1 – 8 days. Due to this fact – but eventually depending on the data source – the amount of data obtained from the satellite sensors is high enough to obtain meaningful data allowing for the calculation of at least weekly, biweekly or monthly average values as well as for setting up alarm- and warning systems (i.e. for algal bloom early detection).

Of course, regional differences can occur and impose special conditions and challenges for several regions. Please contact us to learn more about our experiences with data availability for your region.

All data can be visualised on our web application family eoapp, providing various functions for time series plots and polygon based statistics. The parameter specific raster data can be downloaded as well, is conform to OGC standards and can easily be opened, visualised and analysed in any GIS.

The default file types for our bathymetric data are ASCII XYZQ files (point clouds), GeoTIFFs (georeferenced raster files), KMZ overlays for Google Earth, PDF maps and contour lines (shape files). All data come with a ‘quick look’ and metadata conforming to ISO 19139. Other formats, such as ENC and CAD, are available on request.

Discover our services

In addition to hydrology analysis, we recommend complementary services. Unlock the power of actionable insights from space.