Water Quality

Satellites provide detailed insights into water quality. We help you use these data for monitoring many water bodies at a time, from coastal waters to lakes to river sections. Base your decisions on high quality data to keep control from space.

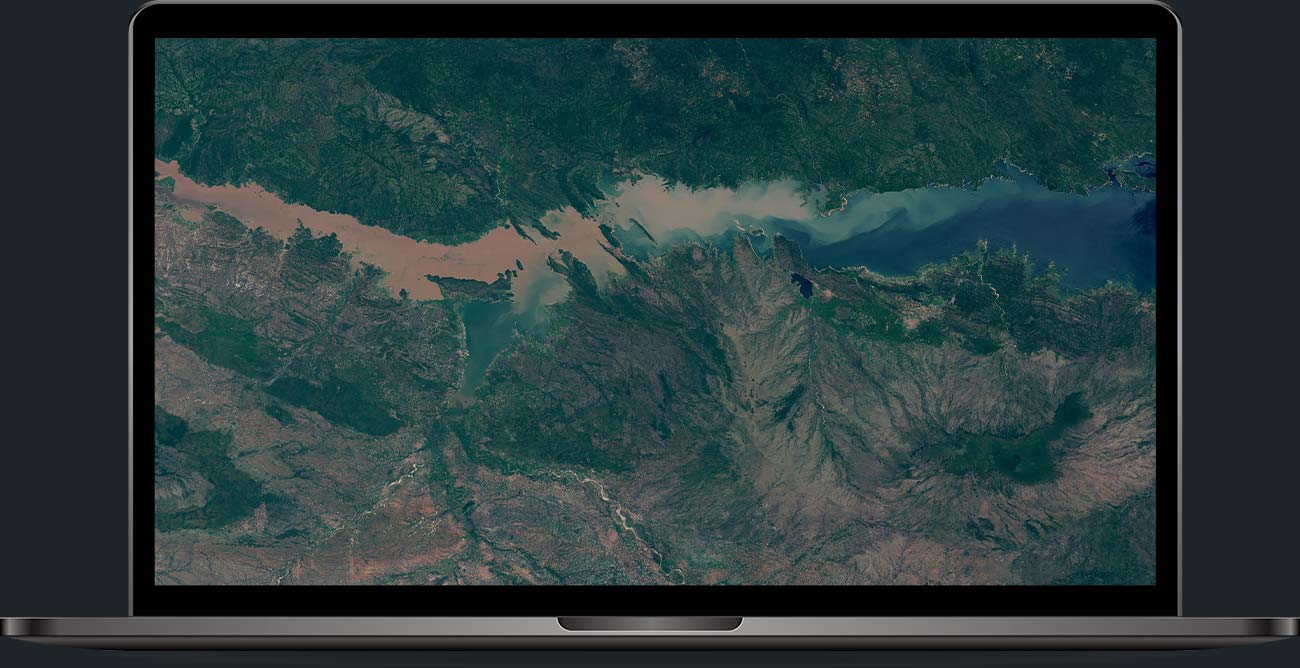
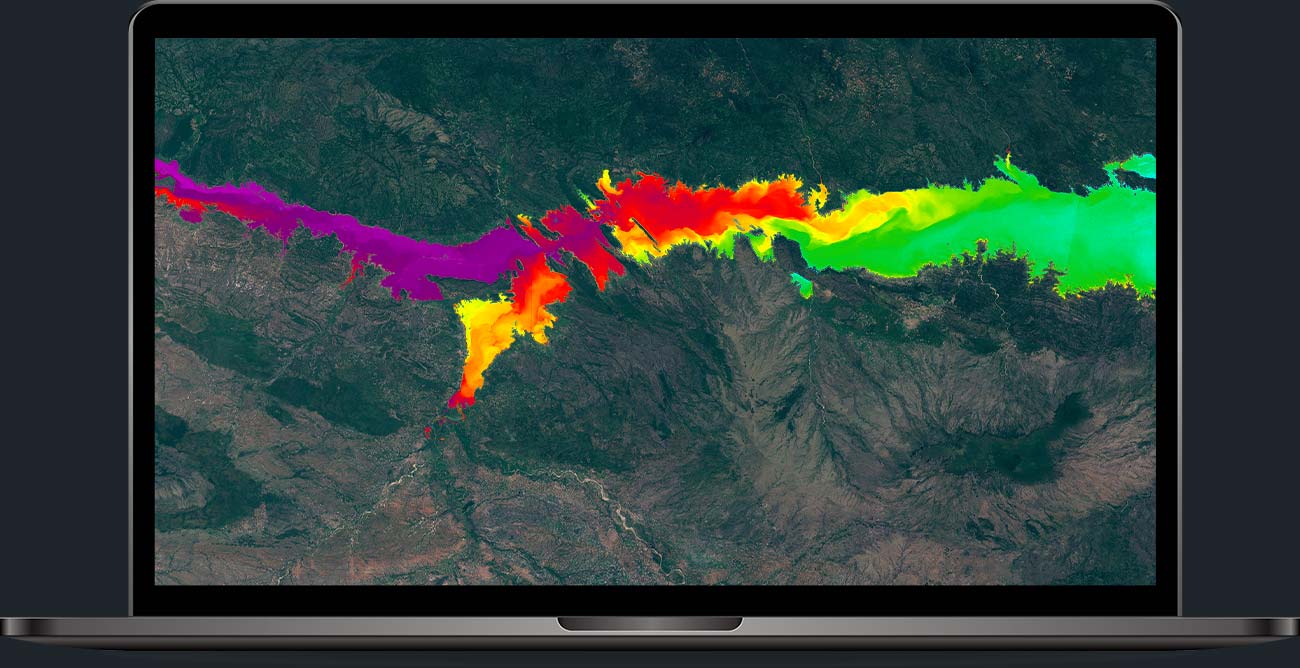
How your result could look

EOMAP’s satellite-based analysis enables a broader and closer look at water bodies. You can track key parameters up to 40 years back in time, monitor seasonal trends and even derive alert workflows. Enjoy this deep understanding of rivers, lakes or reservoirs over space and time.

Wq Cahora Bassa Before RgbWq Cahora Bassa After Tur

What we measure

Build on EOMAP expertise in Earth Observation to better understand inland and coastal waters. Keep an eye on key parameters of water quality and emerging harmful algae blooms. Unveil seasonal patterns and long-term trends in waters worldwide. Experience a wealth of data paired with time- and cost-saving analysis.

Turbidity (TUR) and the related mass concentration of total suspended matter (TSM), are key parameters for assessing the water quality in reservoirs and rivers. They are caused by organic and inorganic particles in the water. High concentrations of particulate matter affect light penetration and productivity, recreational values, and habitat quality. Particles further provide attachment places for pollutants, such as metals, or bacteria. Furthermore, an increased sedimentation and siltation can occur, affecting habitats for aquatic life. Satellite-based turbidity is determined by backward scattering of light in a range of 450 to 800 nm.

We derive this space-based intelligence from a broad range of satellite sensors.

Chlorophyll (CHL) is a parameter that accounts for spectral contributions of chlorophyll-pigments included in phytoplankton cells. It serves as a quantitative proxy for algae abundance in natural waters. Phytoplankton are the foundation of the aquatic food web for primary producers from microscopic, animal-like zooplankton to multi-ton whales. They can therefore provide information about food availability.

EOMAP provides globally standardized Chlorophyll measures. These are based on pigment-specific in-water absorption and spectral characteristics of various pigments, such as Chlorophyll-a and Phaeophytine, in unit µg/l. For these measurements, we use a broad range of different satellite sensors.

Harmful Algal Bloom Indicator (HAB) is a proxy for cyanobacteria. HAB is sensitive to the appearance of Phycocyanin and Phycoerythrin. Cyanobacteria, also called blue-green algae, are microscopic organisms found naturally in all types of water. In warm and nutrient-rich environments, cyanobacteria can multiply quickly, creating blooms that spread across the water surface.

The HAB product provides a qualitative measure by identifying reflectance and absorption discrepancies between the 550 nm and 650 nm wavelength bands.

Secchi Disk Depth (SDD) is a measure of visibility in the water column. It indicates how deep the light can penetrate into the water body. SDD values range from less than a metre in very turbid waters to over 20 metres in very clear ocean conditions, such as the Caribbean. It is calculated from the attenuation coefficient, based on in-water scattering and absorption. Visibility is related to the euphotic zone of the water and is a useful information source for divers.

Water Surface Temperature (SST, °C) corresponds to the temperature at the very surface of the water. This is also known as lake skin surface temperature. The temperature is a fundamental parameter in the modelling of energy fluxes involving the water-air interface. Temperature also affects the quality of water, because it can contribute to the growth and proliferation of aquatic algae and cyanobacteria.

Coloured Dissolved Organic Matter (CDOM/CDM) or Yellow Substance comprises all dissolved organic matter which influences the water colour. It mainly consists of humic or fulvic acids. These often originate from fluvial or ground-water transport, degradation of phytoplankton and aquatic vegetation or surface run-off. In high CDOM areas, the absorption leads to reduced euphotic depth and affects the growth of macrophytes. CDOM is measured in terms of absorption, especially in the blue wavelengths.

The trophic state is a key ecosystem property of water bodies, such as lakes, that determines their overall health and ability to support life. Trophic state covers physical, chemical, and biological processes. For categorising water bodies based on their nutrient levels and biological productivity, there are three main classifications: oligotrophic (nutrient-poor), mesotrophic (moderately productive), and eutrophic (nutrient-rich and highly productive). Using remote sensing, we help clients detect and analyze lake trophic state with a robust method across time and space.

Your benefits

The big picture

Detect an unprecedented wealth of data, such as seasonality, trends and natural variability. Or identify spatial patterns and extreme values in a long-term context.


Increase control over large areas.

Rapid access

Near-real-time processing of the latest satellite overflights allow for a fast overview of all areas of interest (AOIs). User friendly dashboards support a rapid uptake into your  workflows.


Fulfil monitoring and reporting obligations more easily.

Ahead of time

Critical developments, such as algal blooms, are visualised via a smart alert function upon individual thresholds.


See emerging dangers in time.

Assess impacts

Looking back up to 40 years in time, or near-realtime monitoring – both reveal changes.

Assess the impacts of potential sites, existing infrastructure or climate change risks.

Quality awards

EOMAP’s Earth Observation technology has been awarded 15 ti+mes. Recently, we received the Bavarian Innovation Prize 2023, the Copernicus Tech Award 2023, and were top 3 of the German Innovation Award 2025.

Rely on best-in-class technology.

Learn more about Water Quality analyses

EOAPP AQUA

Try the web app for water quality information!

TECH DEEP DIVE

Learn more about the technology behind.

INFO CENTRE

Access downloads, images and more

FAQ

Typical delivery time is between 3-12 hours after data recording or data availability in the archives. The data can be easily accessed through our web application eoapp AQUA and is automatically uploaded as soon as a new image is available.

Records from Earth observation satellites go back up to 40 years. Using transferable processing technologies, we can generate water quality information from this historical data.  The quality and resolution of the information might be lower for older satellite sensors compared with current systems.

Please e-mail your inquiry – including your area of interest (AOI) in digital format – to our water quality team or use our contact form. You’ll receive our feedback within 24 hours on working days. As an alternative, you can directly order water quality data through our web application eoapp AQUA.

Our extensive validation report showcases worldwide validation exercises for different types of water bodies and is updated regularly.

Furthermore, we conduct dedicated field campaigns together with other institutions and partners. The results are published in peer-reviewed papers, such as Bresciani, M. et al. (2019) Monitoring water quality in two dammed reservoirs from multi-spectral satellite data, European Journal of Remote Sensing or Matta, E. et. al (2023); Data Integration for Investigating Drivers of Water Quality Variability in the Banja Reservoir Watershed. Water 2023, 15, 607. https://doi.org/10.3390/w15030607.

A general rule is a minimum mapping unit of at least 5×5 water pixels, depending on the resolution of the satellites. For example, when using a 10-metre-resolution sensor, such as Sentinel-2, the water body should have at least 50×50 metres in extent. Otherwise, adjacent land pixels might overlap with the water pixel and influence the water quality product.

It is important to note that reflections from the water body ground zones can disturb the signal. For this reason, EOMAP usually applies buffer zones at the shoreline of 1-2 pixels to obtain signals from “optically deep water” only. This is particularly relevant for water bodies with very clear water and a high visibility depth.

No, the parameters provided are values, integrated from top of the water surface to the penetration depth of the sunlight. Upon water quality data retrieval from multispectral information, the EOMAP algorithms account for the wavelength dependency in the penetration depth. The depths over which the values are integrated is approximately 1.5x visible depths and thus corresponds to the euphotic zone of the water body under investigation.

Clouds, cloud shadows, atmospheric aerosols and sunlight reflections at the water surface can reduce the number of available scenes. This can affect the number of pixels from the water surface. However, the satellite sources we obtain our data from have very frequent revisit times ranging from 1 – 8 days. Due to this fact, the amount of data obtained from the satellite sensors usually is high enough to obtain meaningful data allowing for the calculation of at least weekly, bi-weekly or monthly average values. This includes the setting up of alarm- and warning systems, for example for the early detection of algal blooms. In general, the results depend on the data sources used and the area of interest.

Of course, regional differences can occur and impose special conditions and challenges. Please contact us to learn more about our experiences with data availability for your region.

EOMAP’s high-quality processing algorithms identify clouds and their shadows, account for a hazy atmosphere or detect water areas with strong sunlight reflections. Pictures in these areas will be removed during the water quality parameter retrieval process and will not contribute to any pixel or polygon based data evaluation.

All data is depicted in the cloud-based eoapp AQUA. This web app patented by EOMAP provides various functions for time series, plots and polygon based statistics. All our delivered polygon-specific time series data is accessible via eoapp AQUA’s Download Centre in formats such as MS Excel or CSV. In addition, the parameter-specific raster data can be downloaded. It conforms to OGC standards and can easily be opened, visualised and analysed in any GIS.

Yes. All your in situ data can easily be opened and visualised in time series plots alongside the satellite-derived water quality data. Once they have been uploaded to eoapp AQUA, you can include them in your analyses.

Floating vegetation is detected, and respective pixels are flagged out. Therefore, pixels in areas covered by emersed macrophytes are not considered in EOMAP’s water quality retrieval. Submersed macrophytes usually grow in shallow areas of the investigated water bodies. This is why shoreline buffer zones in water bodies with a high visible depth help avoid the influence of the aquatic vegetation on the water quality information.

How to order Water Quality services

eoapp and Software

Generate water quality analyses independently, 24/7 and within mouse clicks: eoapp AQUA is a web app for clients in authorities and industry. Apart from other apps and various databases, we provide individual software solutions.

DATA AND CONSULTING

This is your individual solution for robust water quality analyses. Using standardized, physics-based algorithms, EOMAP offers strong project support and full-service solutions. – Contact us for tailored insights from Earth Observation. 

Discover our services

In addition to water quality measurements, our other services foster a deep understanding of coastal and inland water ecosystems. Unlock the power of actionable insights from space!