
Lake Okeechobee is Florida’s largest freshwater lake and a focal point for state restoration efforts. This story focuses on two contrasting years at Lake Okeechobee: 2017, when Hurricane Irma triggered a lake-wide turbidity event, and 2023, when harmful algal blooms were particularly prevalent. Together, they illustrate how satellite-derived monitoring captures very different types of water-quality events at the same location. The story also recommends the same approach to serve water quality management across Florida and the States.
A lake under constant pressure
Lake Okeechobee covers roughly 1,900 km². Decades of nutrient pollution, sediment disturbance, and storm impacts have driven recurring harmful algal blooms and declining water quality, with real consequences:
- Recurring beach and boat-ramp closures
- Toxin levels spiking far above safe thresholds during peak blooms
Satellite data closes the gap

Sunlight passes through the water column, interacts with algae and sediment, and reflects back to the satellite sensor. EOMAP’s physics-based retrieval model turns that signal into quantitative water quality data, down to the Secchi depth, at up to daily revisit rates.
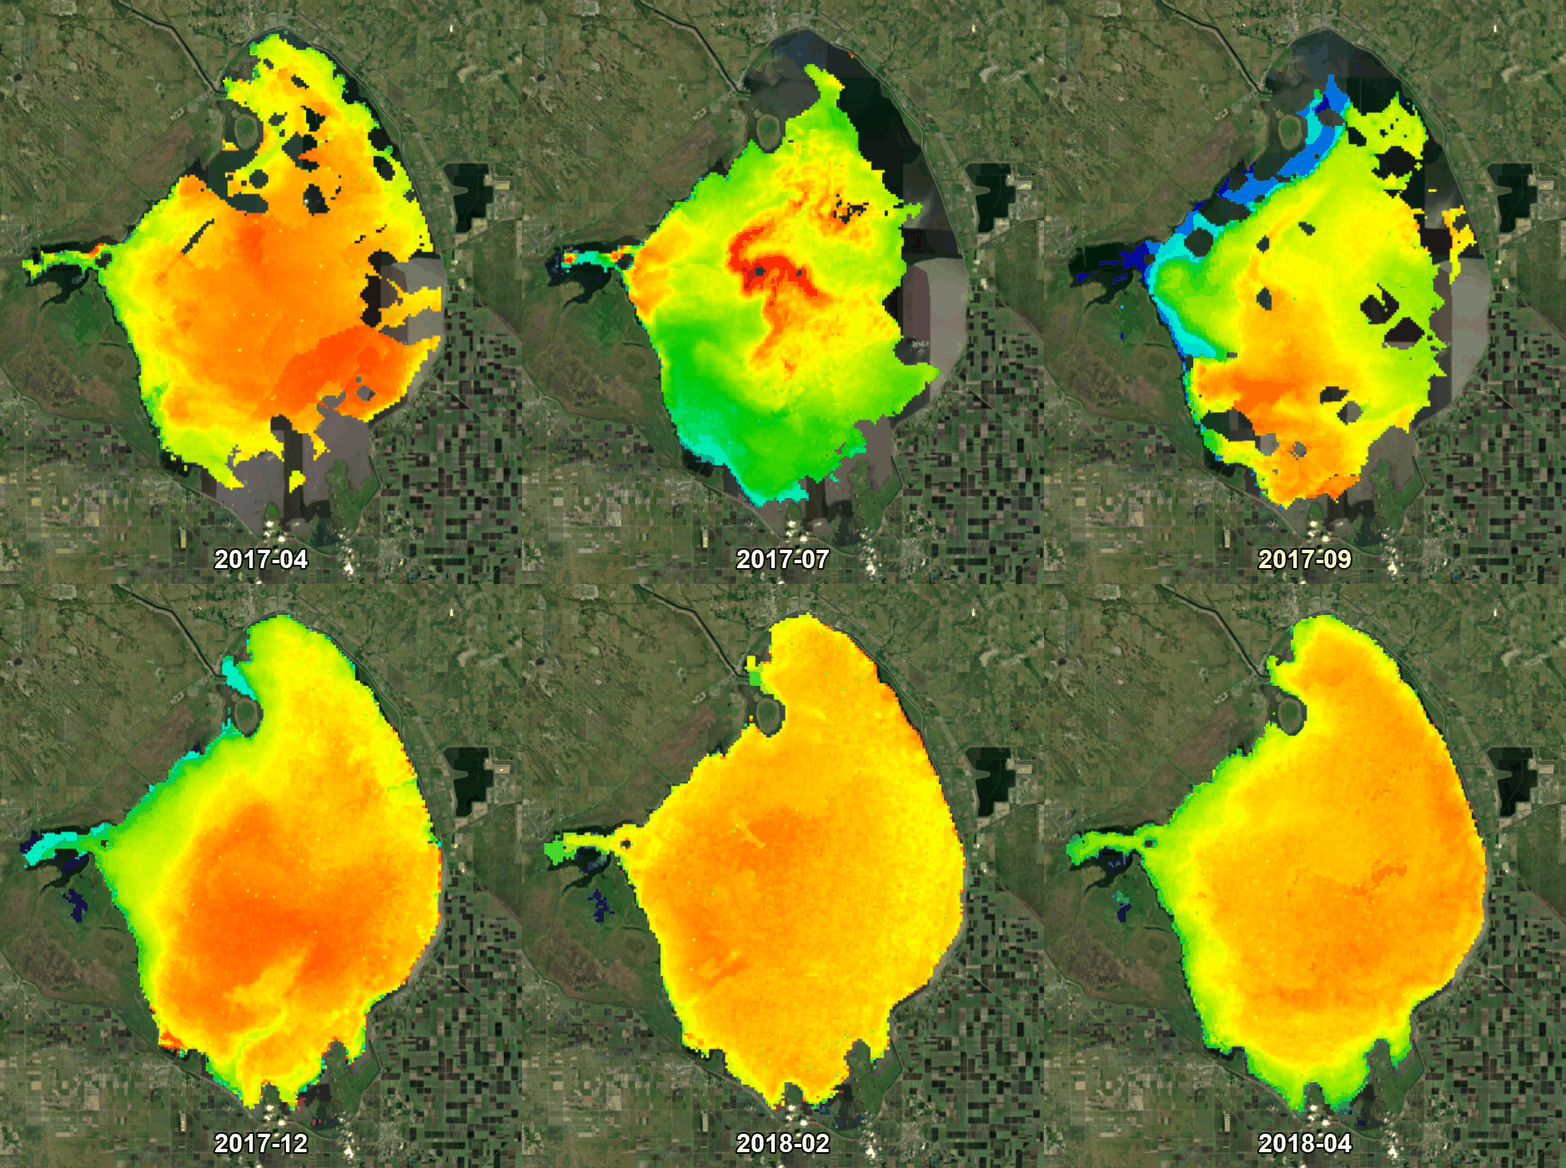
When Hurricane Irma struck in September 2017, this approach captured the resulting turbidity spike within days and tracked its decline over the following seven months. In 2023, it mapped algal bloom conditions across the entire lake.
From one lake to the whole state: supporting Clean Water Act obligations
The continuous, lake-wide and quantitative data shown at Lake Okeechobee also helps meet Clean Water Act obligations. Under the Act, FDEP assesses Florida’s waters, identifies impaired waterbodies and documents their restoration. Satellite monitoring complements field programs, helps focus sampling where it matters most, and provides an independent, well-documented record. The approach can be applied to any Florida waterbody, for example:
- Statewide assessment, including rarely sampled lakes and estuaries
- Restoration and BMAP tracking, for example in the Everglades, the Indian River Lagoon and the Caloosahatchee and St. Lucie estuaries
- Harmful algal bloom early warning
- Post-storm impact and recovery tracking
- Monitoring near permitted discharges, dredging and construction
- Coastal water quality, bathymetry and habitat mapping
Access the Storymap below
Explore the Storymap
Short & Sweet
Florida’s largest freshwater lake has battled decades of pollution and algal blooms. See how satellite monitoring tracked two contrasting crises at Lake Okeechobee, from Hurricane Irma’s turbidity spike to a major bloom event. Learn how the same approach can support Clean Water Act assessment for any waterbody in Florida.
Related Use Cases
Water monitoring along the Zambezi
Advice4COASTS
Kelp monitoring in Los Angeles ports
Snowpower
Impact factors of oxygen loss on Elbe River
Catch-Mekong
Water Quality for Lactec Brazil
HYPOS
Lake Elsinore & Canyon Lake
Space-O