As of 20th January, 2025, the revamped web app enables you to analyse water quality even more quickly and easily. – Below the image, you will find details on the new tools as well as on the improved visualisation and workflows. Access the new eoapp AQUA here.
In “Map View”, you can now
- Directly switch from any virtual station to Monitoring or Baseline View
- Display multiple in-situ layers with remote sensing data in time series graphs
- Show various time series aggregates (daily, monthly, custom) in a graph
- Select sensors specific virtual stations to display different sensor data products within each time series

“Map View” has been further enhanced for you to
- Choose options for displaying and toggling true-colour images and data products
- Modify colour maps for data products with customizable colour display and scaling options to enhance visualization, particularly for low-concentration water substances
- Filter out data points within time series that represent small areas relative to the size of the virtual station of interest
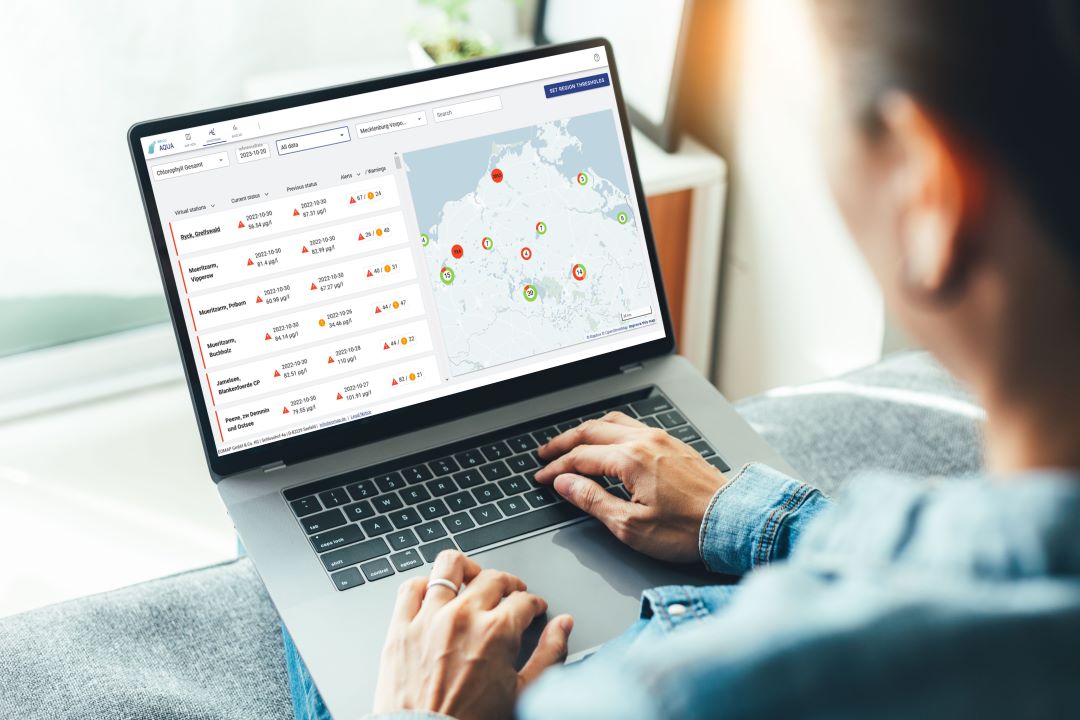
 In “Monitoring”, eoapp AQUA now offers
- A new user interface allowing direct access to virtual station time series without setting regional limits
- The ability to rearrange time series plots for better simultaneous data product evaluation and situation analysis
- Visualisation of station statistics within time series, including medians, means, and station statistics per data point.
We will switch to the upgraded version of eoapp AQUA on 20 January 2025. All your data and virtual stations remain unaffected and accessible as per your agreement with us.
Please contact us in case of any uncertainties. We’ll be glad to help.
Latest EOMAP News

Reuters bases Mekong article on EOMAP data

UKHO’s highest-ranked Satellite-Derived Bathymetry provider in 2015

Mapping the ‘unmappable’ Great Barrier Reef

Dredge plume monitoring using satellite-based turbidity mapping

Pioneering seagrass mapping at the Italian coastline in 2006

Mapping Ningaloo Reef 2009: A Breakthrough in Hyperspectral Marine Habitat Analysis
Related Posts

06 / 2026
Dredge plume monitoring using satellite-based turbidity mapping

04 / 2026
Advocating for Healthy Mountain Ecosystems

04 / 2026
Environmental monitoring for sporting events

04 / 2026
20 Years EOMAP: Advancing Earth Observation

03 / 2026
New BD & Sales Manager for the Americas

03 / 2026
Quick Facts: Lake Eyre

02 / 2026
WATCOR‑X Bathymetry Software for Navies and Hydrographic Offices

02 / 2026
Quick Facts: Ancient Lakes

01 / 2026
Space-based Intelligence for Clean Energy

01 / 2026
